Using the console from Grafana
The Narwhal Orchestrator dashboard has a Fleet control link in its dashboard links, which opens the console in a new tab. The dashboard also marks each action and load job on its charts.
Open the console from Grafana
The service must be set up as in Setting up the control service.
- If the browser reaches the console at an address other than
http://127.0.0.1:18020/console, setNARWHAL_CONTROL_CONSOLE_URLto that address in the router shell. For a console served under Grafana's own address, use its path, such as/fleet-control/console. - To mark actions and load jobs on the charts, set up dashboard annotations.
- Run
make observeon the router host. - Open the tunnel, as in Reaching the console through the tunnel.
- Open
http://127.0.0.1:13000/d/narwhal-router/narwhal-orchestratorand select Fleet control.
The console opens in a new tab. After you connect, the session strip shows Connected.
Dashboard annotations
The Narwhal Orchestrator dashboard marks fleet control activity on its charts with two annotation layers:
- Fleet control actions draws a dashed purple line at the start of each engine action, overlay, cold restart and restore, labelled with the action and target, such as
drain n7. - Load jobs shades each load job's interval and labels it with the job ID.
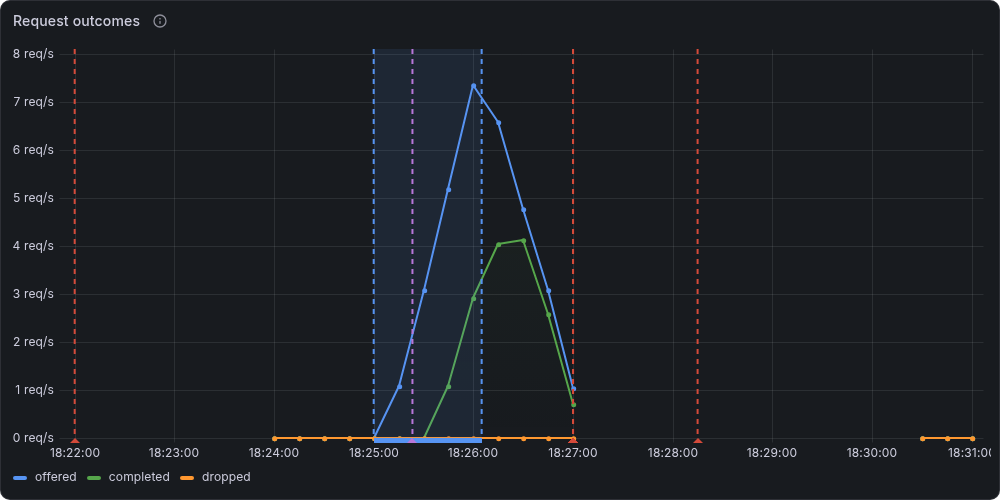
Prometheus reads these events from the control service's GET /metrics. To add the scrape:
- In the router shell, export the control token in
NARWHAL_CONTROL_TOKEN. -
Export the control service's address as Prometheus reaches it. With the default host and port:
-
Run
make observe. It writes thefleet-controlscrape target and passes the token to Prometheus. -
Query the scrape status:
curl -fsSG http://127.0.0.1:9090/api/v1/query \
  --data-urlencode 'query=up{job="fleet-control"}' \
  | python3 -m json.tool
A value of
1marks a successful scrape.
make observe reads the token from NARWHAL_CONTROL_TOKEN, even when the service's token_env names another variable. After the service restarts with a new token, run make observe again.
Framing boundary
With console.embed_in_grafana set, the console accepts frames from the console.grafana_url origin and from its own origin.
A console served under Grafana's own address, such as /fleet-control/console, shares Grafana's origin, so script in Grafana pages can read its token. Serve the console on its own port to keep the token separate from Grafana.