Reading the dashboard
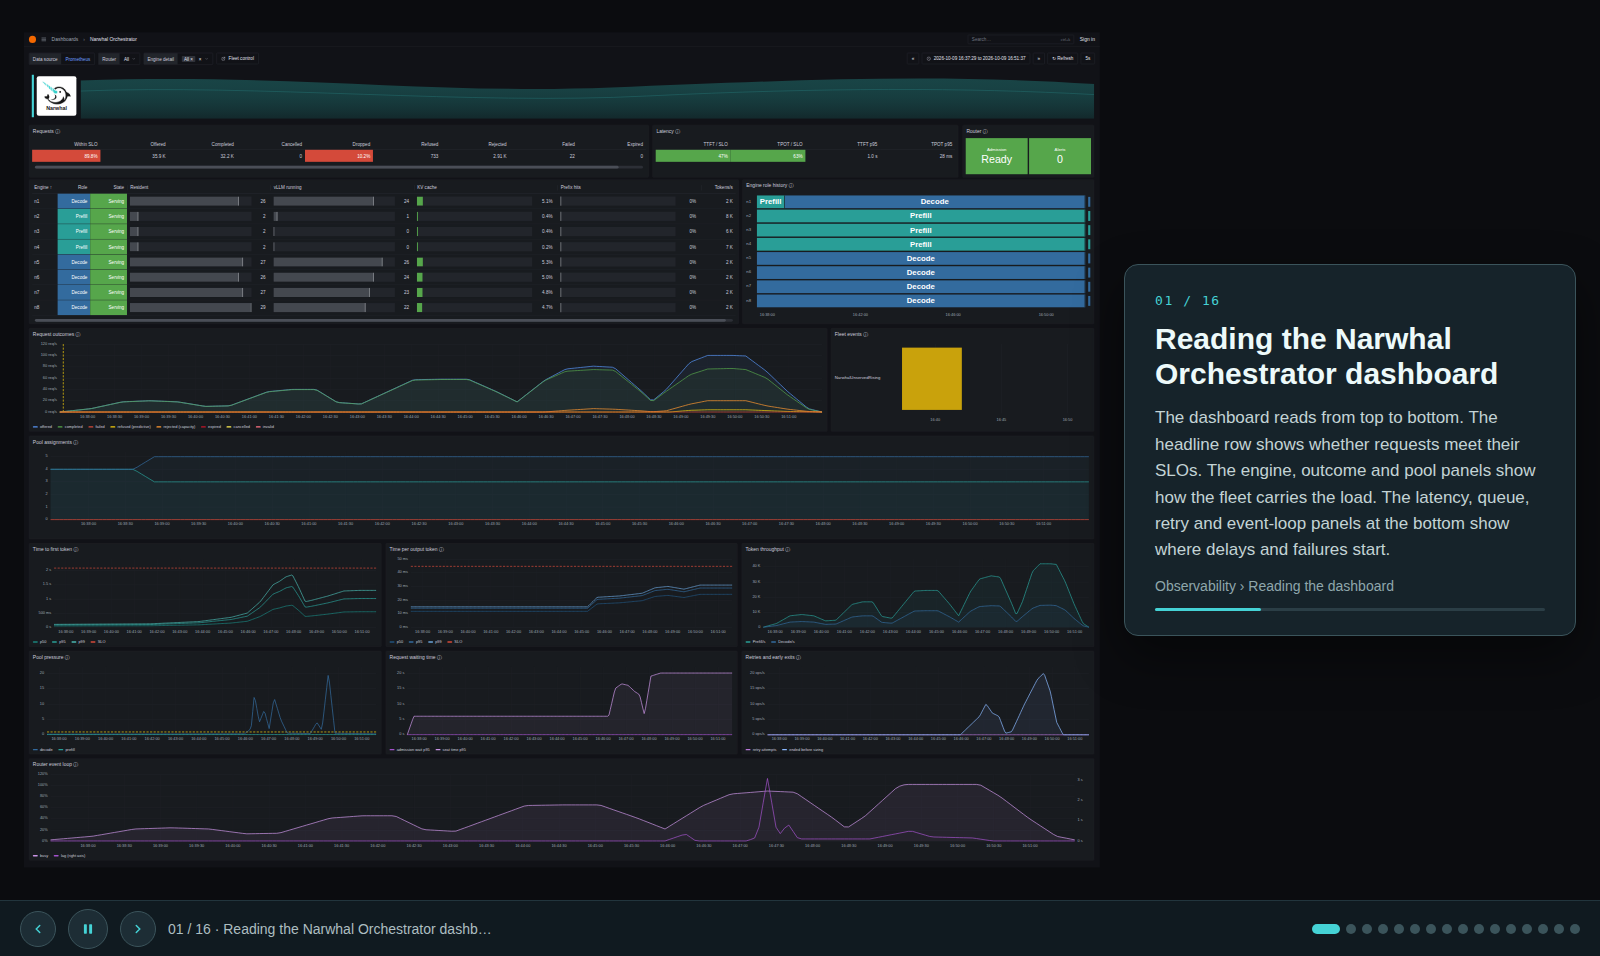
The Narwhal Orchestrator dashboard reads from top to bottom. The headline row shows whether requests meet their SLOs. The engine, outcome and pool panels below it show how the fleet carries the load and why requests drop. The latency, admission, queue, retry and router event-loop panels at the bottom show where delays and failures start.
Below the headline row, the dashboard groups its panels under titles that match the sections of this page. Select a title to hide or show its panels.
Open the dashboard through the tunnel in Accessing the dashboard from a workstation.
Walkthrough
Selectors
The Router selector scopes every panel built from router metrics. Engine detail narrows the engine table and Engine role history to the engines you pick. Both selectors default to All.
Colours
Each colour keeps one meaning on every panel. In the headline row, cells that judge the service fill green, yellow or red, and count cells show plain values.
These colours mark the engine roles, the phases and completed work on every panel:
| Colour | Hex | Meaning |
|---|---|---|
| Teal | #299E97 |
Prefill role, pool and phase, Prefill/s and TTFT p95 |
| Teal shades | #1A847E, #49B7B0 |
TTFT p50 and p99 |
| Blue | #336B9E |
Decode role, pool and phase, Decode/s and TPOT p95 |
| Blue shades | #21537E, #69A2D8 |
TPOT p50 and p99 |
| Violet | #8C84CE |
Colocated role |
| Green | #56A64B |
Serving, completed, KV cache below 80% and headline values within their limit |
The engine table and Engine role history colour engine states:
| Colour | Hex | Meaning |
|---|---|---|
| Amber | #C8963E |
Backlogged, Probation, Verifying and KV cache from 80% |
| Burnt orange | #E0752D |
Quarantined |
| Red | #D44A3A |
Ejected, Unreachable and KV cache from 95% |
| Maroon | #A11D1D |
Blocked |
| Magenta | #9E4AA4 |
Switching and Validating |
| Grey | #8E9196 |
Draining, Restarting, N/A and the engine table bars |
| Brown | #9C6B4E |
Probing, Calibrating, Profiling and Preflight |
The charts and the headline row colour request outcomes, alerts, status values and the router's own measurements:
| Colour | Hex | Meaning |
|---|---|---|
| Light blue | #5794F2 |
offered |
| Pale blue | #8AB8FF |
ended before sizing |
| Light yellow | #FFEE52 |
cancelled |
| Yellow | #F2CC0C |
refused, retries denied, warnings, the pool target, the in-flight limit and headline values near their limit |
| Orange | #FF9830 |
rejected |
| Pink | #FF7383 |
invalid |
| Red | #D44A3A |
failed, pages, SLO lines, ejected engines and headline values past their limit |
| Dark red | #C4162A |
expired requests |
| Purple | #B877D9 |
retry attempts and retry credits |
| Dark purple | #A352CC |
admission queue and wait, and event-loop lag |
| Light purple | #CA95E5 |
seat time, requests in flight and event-loop busy share |
Headline row
The Requests and Latency tables summarise the displayed interval. Router shows whether the router admits traffic and how many Narwhal alerts are firing now.
| Requests column | Shows |
|---|---|
| Within SLO | Share of ended requests that met both the TTFT and TPOT SLOs |
| Offered, Completed, Cancelled | Requests clients sent, requests completed and requests their clients abandoned |
| Dropped | Share of ended requests that were refused, rejected, failed or expired |
| Refused, Rejected, Failed, Expired | The count of each dropped outcome |
Ended requests are completed, failed, refused, rejected, expired and cancelled requests.
| Latency column | Shows |
|---|---|
| TTFT / SLO, TPOT / SLO | 95th-percentile time to first token and time per output token as a share of the SLO the router ran with |
| TTFT p95, TPOT p95 | The same percentiles as times |
Status colours:
| Value | Green | Yellow | Red |
|---|---|---|---|
| Within SLO | 95% or more | 90% to 95% | below 90% |
| Dropped | below 1% | 1% to 5% | 5% or more |
| TTFT / SLO and TPOT / SLO | below 80% | 80% to 100% | 100% or more |
| Admission | Ready | Not ready or Offline | |
| Alerts | 0 | 1 or more |
Engines and engine role history
The engine table shows each engine's backend, current role, state and load, 8 engines per page. Engine role history beside it lists the same engines in the same order and shows how their roles changed over the selected time range. Each panel has its own page controls, and page n of one lists the same engines as page n of the other.
Role and State tell you what the engine does and whether it takes placements. The Resident and Engine running bars scale to the busiest engine.
| Column | Shows |
|---|---|
| Engine | Engine ID (iid) |
| Backend | Logo of the engine's backend, vLLM, SGLang or llama.cpp |
| Role | Current pool assignment: Prefill, Decode or Colocated |
| State | The most serious engine state |
| Resident | Narwhal requests currently on the engine |
| Engine running | Requests the engine reports as running in vllm:num_requests_running or sglang:num_running_reqs |
| KV cache | KV cache use from vllm:kv_cache_usage_perc or sglang:token_usage, amber from 80% and red from 95% |
| Prefix hits | Share of prompt tokens served from the engine's prefix cache: vllm:prefix_cache_hits_total over vllm:prefix_cache_queries_total, or sglang:cached_tokens_total over sglang:prompt_tokens_total |
| Tokens/s | Prompt tokens prefilled per second on prefill engines, and output tokens per second on decode and colocated engines |
In Engine role history, teal is Prefill, blue is Decode and violet is Colocated. A change between roles is a role flip. While an engine is out of service, its row takes the colour of its State cell in the engine table.
Request outcomes and fleet events
Request outcomes shows what happened to client requests, and Fleet events shows which alerts fired at the same time.
In a healthy fleet, completed follows offered and the other series stay near zero. When a gap opens between those two lines, the series that rises inside it shows where the missing requests went:
| Series | Requests per second |
|---|---|
| offered | Original completion requests received, including early refusals |
| completed | Requests completed successfully |
| failed | Requests that ended in an error |
| refused (predictive) | Requests predictive admission refused for a projected TTFT or decode SLO miss |
| rejected (capacity) | Requests refused with HTTP 429 for capacity or HTTP 503 for router readiness |
| expired | Requests terminated by their admission or total deadline |
| cancelled | Requests their client abandoned before completion |
| invalid | Malformed or unsupported client requests rejected before dispatch |
When a Narwhal alert starts firing, a red (page) or yellow (warning) dashed marker appears on Request outcomes. Hover over a marker for its severity and, for NarwhalEngineDown, the engine.
Fleet events gives each alert its own row, with one row per engine for NarwhalEngineDown. A red or yellow bar marks the time the alert fires.
Pool assignments
Pool assignments shows how many engines serve each phase over time.
The teal line counts prefill engines, the blue line counts decode engines and the red line counts engines the breaker ejected. Mirrored steps in the teal and blue lines mark a role flip.
Latency and token throughput
These panels show how long requests take and how much work the engines complete.
Time to first token plots the p50, p95 and p99 time from router arrival to the end of prefill. Time per output token plots the same percentiles of each ended request's average time between output tokens after prefill.
Both panels draw the selected router's SLO as a dashed red line. When p95 crosses it, more than 5% of requests in that window missed the SLO.
Token throughput plots two rates: prompt tokens the engines prefill (Prefill/s) and output tokens the router observes (Decode/s). On vLLM, Prefill/s counts the local_compute and local_cache_hit prompt tokens, or vllm:prompt_tokens_total on engines that report only the total. On SGLang, it counts sglang:prompt_tokens_total on engines outside the decode and colocated roles.
Pool pressure, admission and queue depth
These panels show pool load, admission seats and the requests waiting at each queue stage.
Pool pressure plots each pool's load as a fraction of its SLO target, and the dashed yellow line at 1 marks the target. When a pool's load stays at or above controller.thresholds.expand (default 1.0), reactive role control can move an engine into that pool.
Admission in-flight plots the requests holding an admission seat (narwhal_admission_inflight) against the router in-flight limit (narwhal_admission_inflight_limit), drawn as a dashed yellow line.
Queue depth plots the requests waiting at each stage:
| Series | Metric | Requests waiting |
|---|---|---|
| admission | narwhal_queued |
For an admission seat |
| prefill | narwhal_waiting_prefill |
For a prefill engine seat |
| decode | narwhal_waiting_decode |
For a decode engine seat |
When the prefill or decode line rises, no engine of that phase has a free seat. When the admission line rises while Admission in-flight sits at its limit, every admission seat is taken.
Request waiting time and retries
These panels show how long requests wait and how the router retries failed attempts.
Request waiting time plots the p95 wait at each queue stage from narwhal_queue_wait_seconds, split by its stage label: admission wait p95 for an admission seat, and prefill seat wait p95 and decode seat wait p95 for an engine seat. seat time p95 shows how long a request holds an admission seat. Queue waits defines the bounds and outcomes.
Retries and early exits plots these rates:
| Series | Per second |
|---|---|
| retry attempts | Additional prefill attempts after an original attempt failed |
| retries denied | Retries the shared retry quota denied, each ending a request the retry policy would retry |
| completed after retry | Requests completed by an attempt after the first |
| ended before sizing | Requests that ended before input sizing |
Retry credits plots narwhal_retry_credits, the credits available for new retries. The retry settings define the pool's size, spending, and replenishment.
Router event loop
Router event loop shows the selected router's event-loop busy share and monitoring-deadline lag.
| Series | Shows |
|---|---|
| busy | Share of wall time the event-loop thread spends on CPU, from rate(narwhal_event_loop_busy_seconds_total), on the left axis |
| lag | narwhal_event_loop_lag_seconds, the delay beyond the latest scheduled monitoring deadline, on the right axis |
Engine states
The State column shows the most serious state that applies to an engine. The states run from least to most serious:
| State | Meaning | Service |
|---|---|---|
| Serving | Normal operation | In service |
| Switching | The engine finishes requests from its previous role after a flip | In service |
| Backlogged | The engine reports waiting requests in vllm:num_requests_waiting or sglang:num_queue_reqs |
In service |
| Probing | The engine serves requests from a client other than a router or a Narwhal tool that reports it | In service |
| Calibrating | narwhal-check --calibrate-first-token reports the engine in its tool metrics |
In service |
| Profiling | narwhal-profile reports the engine in its tool metrics |
In service |
| Preflight | narwhal-check preflight reports the engine in its tool metrics |
In service |
| Probation | Placement ranks the engine lower after latency drift | In service |
| Verifying | A breaker health or inference probe is in flight | In service |
| Quarantined | A failure quarantine or inference-probe hold keeps the engine out of placement | Out of service |
| Draining | An operator drain holds the engine out of placement | Out of service |
| Ejected | The breaker removed the engine from placement | Out of service |
| Validating | Readmission checks run against the engine | Out of service |
| Blocked | The engine waits for an operator, for example after a failed readmission check or during a whole-wave restart hold | Out of service |
| Unreachable | The engine's metrics endpoint fails to answer Prometheus | Out of service |
| Restarting | The engine is unreachable while a drain holds it | Out of service |
Probing marks work from another client, such as a direct request or a Narwhal tool that Prometheus does not scrape. It appears 8 to 14 seconds after the work starts, or at the next scrape when the engine worked in the previous 23 seconds, and clears 5 to 10 seconds after the work ends. On SGLang 0.5.21, a prefill engine's work ends with its last KV transfer. A request that starts and ends between two of the engine's 5-second scrapes shows only when the engine also worked 8 to 23 seconds earlier.
Probing stays off during an engine's first 23 seconds of scrapes, for 32 to 37 seconds after a router's last request to the engine, and for 37 seconds after a router last held work on it or a scraped tool last reported it. On every engine, it stays off from a router's first scrape after the router starts or stops, 0 to 5 seconds after the change, until 32 to 37 seconds after it. An engine that a scraped tool reports reads Calibrating, Profiling or Preflight, and returns to Serving 0 to 5 seconds after the tool exits.